Chicago Divvy Bike-Share
In this project I analyzed Divvy's historical bicycle trip data in order to identify trends and understand how casual riders behave differently from riders with paid memberships. This analysis will help executives to make decisions about marketing programs and strategies to convert casual riders to riders with annual memberships. Data is cleaned, transformed, and analyzed using Microsoft SQL Server while visualizations are made using Tableau.
Background
Divvy is a bike-share company in Chicago that features more than 5,800 bicycles and 600 docking stations. The company offers different types of bikes that caters to the customers needs. The company also offers pricing plans: single-ride passes, full-day passes, and annual memberships.
About the Data
I used 12 Months of Historical Trip Data starting from June 2021 to May 2022. This data is available to the public and is released on a monthly schedule. More information can be found here . The data has been made available by Motivate International Inc. under this license. The data is anonymized and includes:
Cleaning and Transforming
I have made two new columns which are the ride duration column, calculated from the starting and ending dates, and a day-of-the-week column to help me in facilitating my analysis.
Upon checking the data, there are some rows with duration of negative values. I have decided to just delete all data with a duration less than 1 min since those may not have been actual trips while the sample size will stay large. I have also deleted some rows with empty strings.
Analysis
I have decided to go for metrics that would help me distinguish how each rider types behave differently:
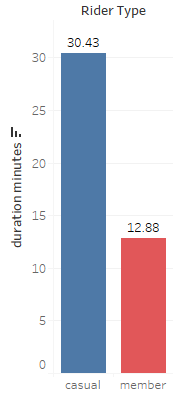
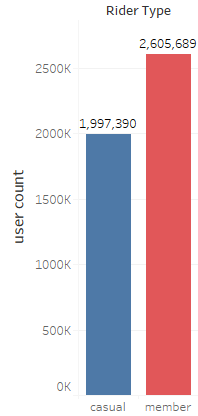
First, let's see the rider type distribution and average trip duration of each rider type.
Average Duration in Minutes
Rider Distribution
Casual riders average trip duration is double than those members.
Let's also see how they both riders differ per month, day of the week, and hour of the day.
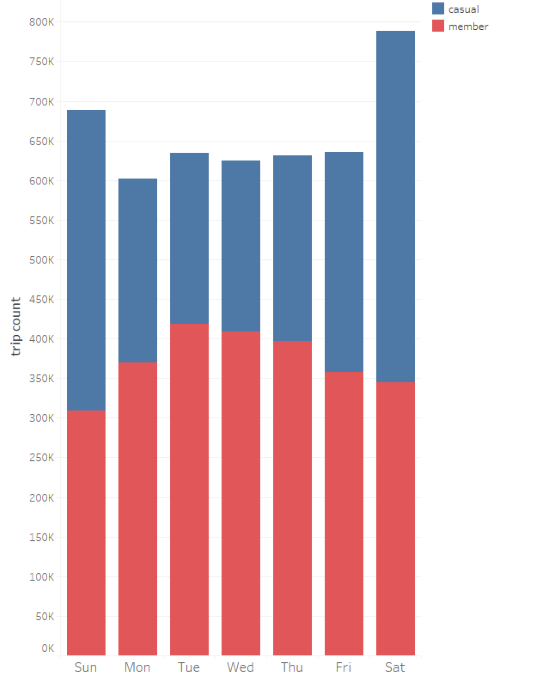
Trips per day of the week
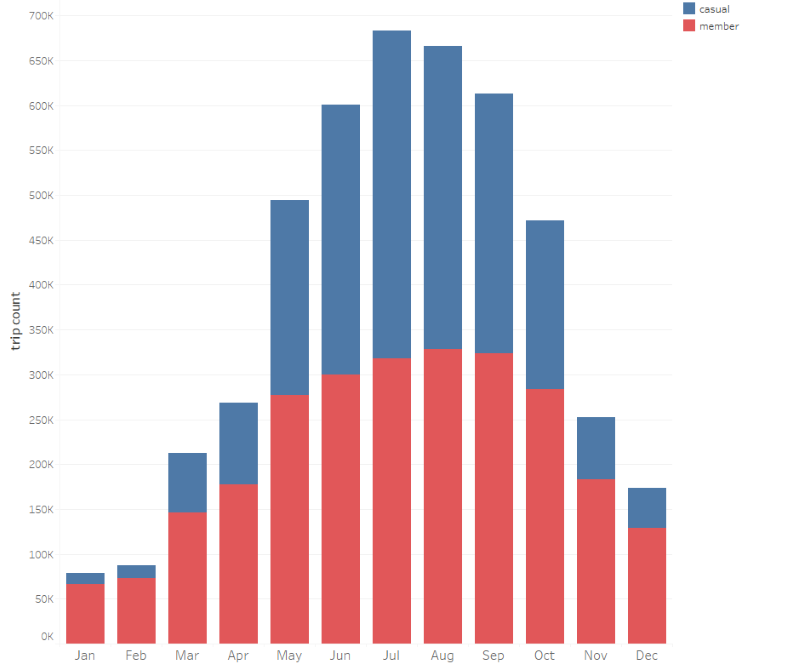
Trips per month
Members tend to use the service slightly more during the weekdays, while as for casuals, there is a significant increase in trips during the weekends.
Both riders also uses the service more during the warmer months from May to October.
I also want to see whether the day of the week contributes to the average ride duration as well.
Average duration per day of the week
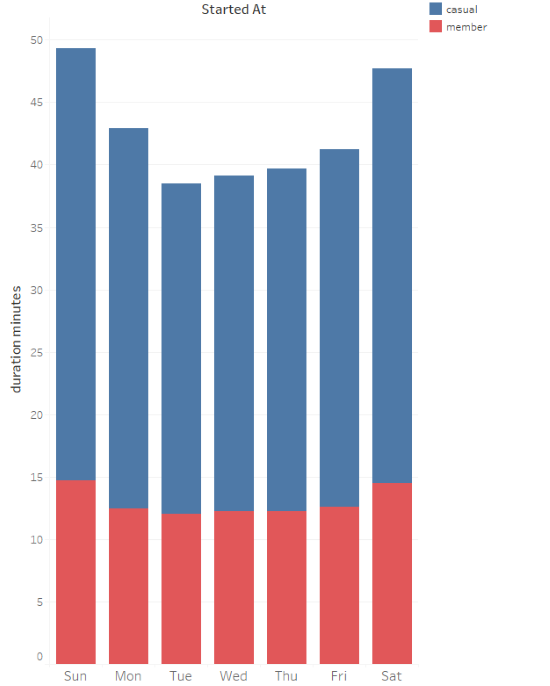
Casuals not only uses the service more during the weekends, their average ride duration also increases.
Trip count per hour

Both trip counts increases starting at 5AM and decreases after 5PM. There's also a significant increase of member riders between 7AM to 8AM which is not the case for casual riders.
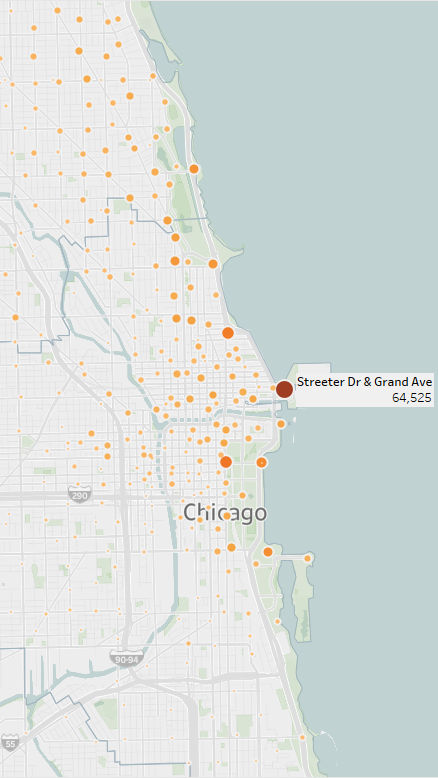
Starting stations heat map- Casual
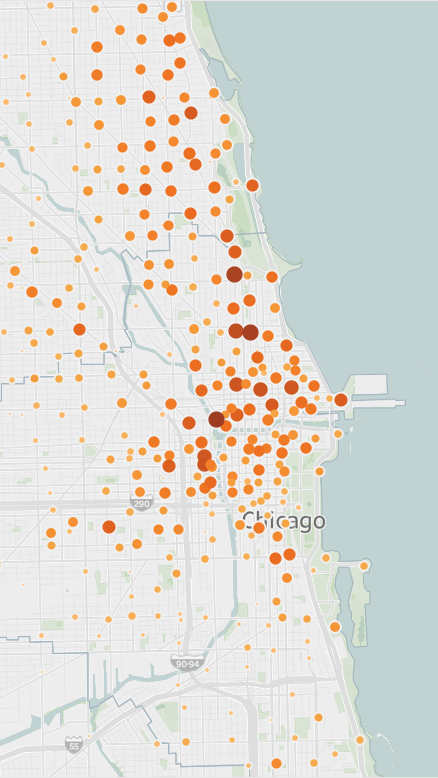
Starting stations heat map- Member
Top 10 starting stations- Member
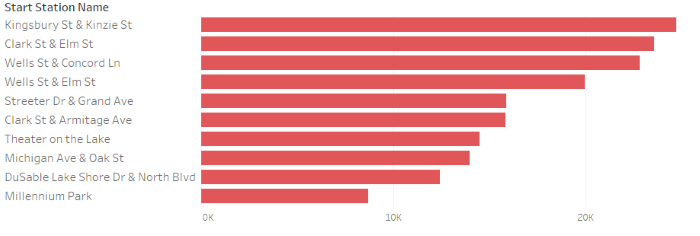
Top 10 starting stations- Casual
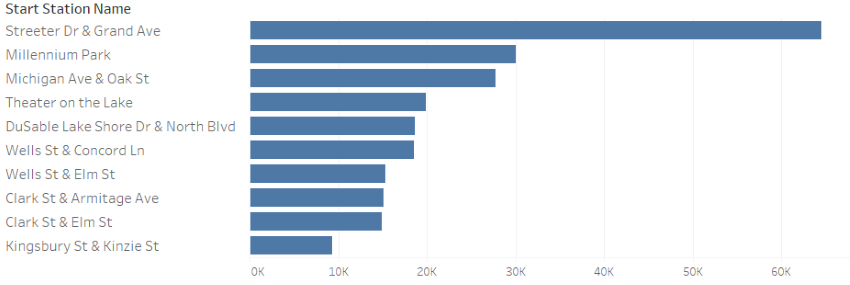
A large volume of casual trips is located at the Street Dr & Grand Avenue station. According to the data there were total of 1,997,390 casual trips among 988 stations. 3% of those trips were started at Street Dr & Grand Avenue with 64,525 casual trips.
Lastly, I want to check if there were some significant dates on the top 10 dates for each rider type with the highest trip count.
Top 10 dates with highest number of trips - Casual

Top 10 dates with highest number of trips - Member
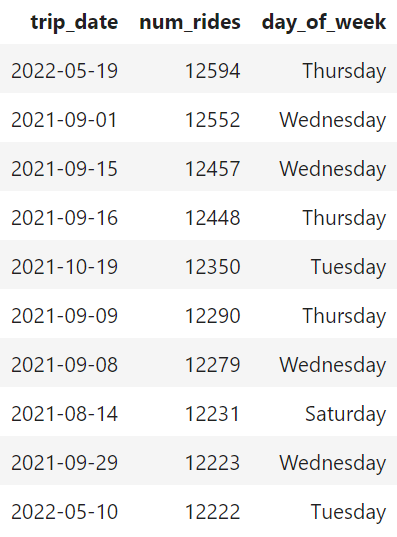
4 out 10 of the top trip dates for casuals includes weekends where holidays are set: Sep 5th (Labor Day), June 19 (Juneteenth), July 3rd-4th (Independence day). Top trip dates for members are not set around holiday dates compared to casuals.
Key Findings
Based on my analysis, the data show:
- Members uses the service more during weekdays with a consistent average trip duration through the whole week. Trip counts for casuals increases to almost double during the weekends along with an increase of average trip duration.
- For members, two peak times occurs from 7AM to 8AM and from 5PM to 6PM. Casuals have only one peak time that occurs during 5PM to 6PM. A possible reason is that casual users uses the service more for leisure activities during the afternoon compared to members that uses the service as a means of transportation or commute for work or school.
- Riders are influenced by temperature. There are more trips during summer months and a decrease of trips during winter.
- Casuals are likely to use the service during holidays.
- Big portion of casual riders uses the Street Dr. and Grand Avenue Station which amounts to 3% of all trips by casuals.
- Most casual riders uses stations that are near the Lake, while members starting station are concentrated in the downtown area.
Recommendations
Some recommendations to encourage casual to become members:
- Offer some kind of promotion for weekend-only or seasonal month type membership.
- Post ads during the hours, months (Summer months), and days (holidays) where casual rides are increasing.
- Offer some kind of points-based incentives where members are given rewards the longer their total trip duration is. This is would encourage casuals since their average ride duration is double than members.
- Show campaign ads on areas where top stations used by casuals are located. Partner with businesses that are located near those areas for campaigning. Coordinate with any events during the months and days with high number of trips and those events that are located near the most used casual stations.
- Offer discounts or free trips for the first few months for current casuals that are converting to a member pricing plan.